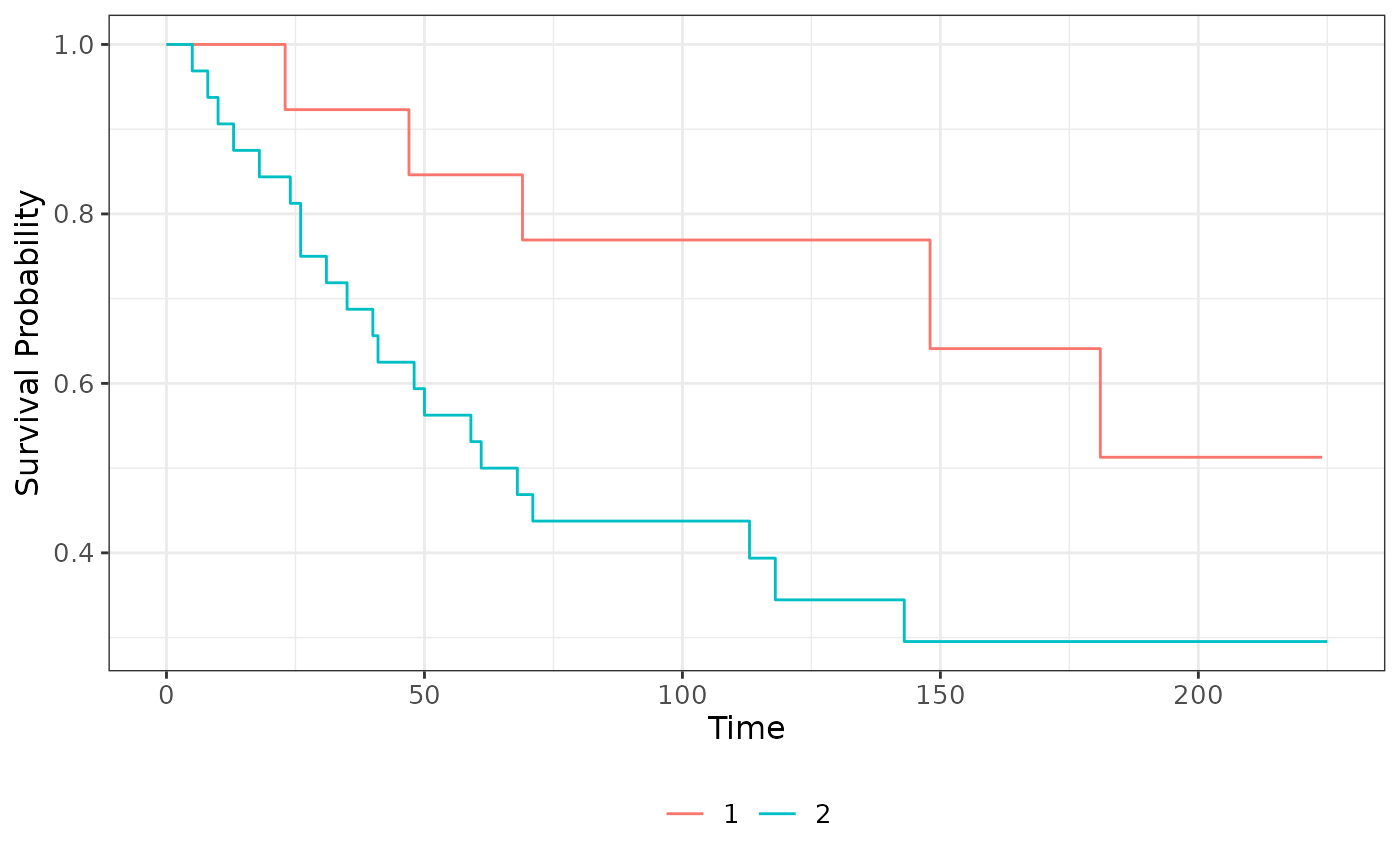
Survival times, in months, of 45 women who received a mastectomy for a Grade II, III or IV breast tumour, classified by whether the tumour stained positively or negatively with the lectin HPA (Collett, 2023, Example 1.2).
Format
A data frame with 45 rows and 3 variables:
- stain
Result of HPA staining: 1 = negative, 2 = positive. Positive staining indicates a tumour with the potential to metastasise.
- time
Survival time in months from surgery.
- status
Event indicator: 1 = death from breast cancer, 0 = right-censored.
Source
Collett, D. (2023) Modelling Survival Data in Medical Research, 4th ed. Chapman & Hall/CRC, Example 1.2 (Table 1.2). Data from Leathem and Brooks (1987).
Details
The women were treated between January 1969 and December 1971 and the study was closed in July 1987. Women still alive at that date, as well as women who died from causes other than breast cancer, contribute censored times. There are 13 women in the negative-staining group and 32 in the positive-staining group, with 26 deaths in total.
This is the standard small example for comparing two survival curves: the
Kaplan-Meier estimate by group (Examples 2.11-2.14), the log-rank and
Wilcoxon tests (Section 2.4) and a Cox model with stain as the single
covariate (Examples 3.1 and 3.3).
Aliases
The data set is available under the aliases d1.2, d2.11, d2.12,
d2.13, d2.14, d3.1, d3.3, d5.5, d5.6, d5.7, d5.8, d5.13,
d5.14, d5.17, d10.1, d10.2, d16.4, d16.5, d16.6; dX.Y is
the alias for the data set used in Example X.Y of Collett (2023). See
dataset_by_exercise for the complete index.
Examples
# Collett (2023), Chapter 17 style -----------------------------------
# Example 1.2: survival by HPA staining (1 = negative, 2 = positive)
survival::survfit(survival::Surv(time, status) ~ stain, data = breast)
#> Call: survfit(formula = survival::Surv(time, status) ~ stain, data = breast)
#>
#> n events median 0.95LCL 0.95UCL
#> stain=1 13 5 NA 148 NA
#> stain=2 32 21 64.5 41 NA
# Examples 2.11-2.14: log-rank and Peto-Peto tests
survival::survdiff(survival::Surv(time, status) ~ stain, data = breast)
#> Call:
#> survival::survdiff(formula = survival::Surv(time, status) ~ stain,
#> data = breast)
#>
#> N Observed Expected (O-E)^2/E (O-E)^2/V
#> stain=1 13 5 9.57 2.18 3.51
#> stain=2 32 21 16.43 1.27 3.51
#>
#> Chisq= 3.5 on 1 degrees of freedom, p= 0.06
survival::survdiff(survival::Surv(time, status) ~ stain, data = breast, rho = 1)
#> Call:
#> survival::survdiff(formula = survival::Surv(time, status) ~ stain,
#> data = breast, rho = 1)
#>
#> N Observed Expected (O-E)^2/E (O-E)^2/V
#> stain=1 13 3.0 6.6 1.97 4.11
#> stain=2 32 15.7 12.1 1.08 4.11
#>
#> Chisq= 4.1 on 1 degrees of freedom, p= 0.04
# Examples 3.1 and 3.3: Cox model with the staining indicator
fit_breast <- survival::coxph(survival::Surv(time, status) ~ stain, data = breast)
summary(fit_breast)
#> Call:
#> survival::coxph(formula = survival::Surv(time, status) ~ stain,
#> data = breast)
#>
#> n= 45, number of events= 26
#>
#> coef exp(coef) se(coef) z Pr(>|z|)
#> stain 0.9093 2.4827 0.5009 1.815 0.0695 .
#> ---
#> Signif. codes: 0 ‘***’ 0.001 ‘**’ 0.01 ‘*’ 0.05 ‘.’ 0.1 ‘ ’ 1
#>
#> exp(coef) exp(-coef) lower .95 upper .95
#> stain 2.483 0.4028 0.9302 6.626
#>
#> Concordance= 0.603 (se = 0.042 )
#> Likelihood ratio test= 3.88 on 1 df, p=0.05
#> Wald test = 3.3 on 1 df, p=0.07
#> Score (logrank) test = 3.52 on 1 df, p=0.06
#>
# Examples 5.5-5.8, 5.13, 5.14 and 5.17: Weibull models
survival::survreg(survival::Surv(time, status) ~ stain, data = breast, dist = "weibull")
#> Call:
#> survival::survreg(formula = survival::Surv(time, status) ~ stain,
#> data = breast, dist = "weibull")
#>
#> Coefficients:
#> (Intercept) stain
#> 6.8510285 -0.9966647
#>
#> Scale= 1.066777
#>
#> Loglik(model)= -156.7 Loglik(intercept only)= -158.8
#> Chisq= 4.14 on 1 degrees of freedom, p= 0.0418
#> n= 45
# Modern tools --------------------------------------------------------
if (requireNamespace("ggsurvfit", quietly = TRUE)) {
ggsurvfit::survfit2(survival::Surv(time, status) ~ stain, data = breast) |>
ggsurvfit::ggsurvfit() |>
ggsurvfit::add_risktable()
}
#> list()
#> attr(,"add_risktable")
#> attr(,"add_risktable")$times
 #>
#> attr(,"add_risktable")$risktable_stats
#> [1] "{n.risk}" "{cum.event}"
#>
#> attr(,"add_risktable")$stats_label
#> NULL
#>
#> attr(,"add_risktable")$combine_groups
#> [1] FALSE
#>
#> attr(,"add_risktable")$risktable_group
#> [1] "auto"
#>
#> attr(,"add_risktable")$risktable_height
#> NULL
#>
#> attr(,"add_risktable")$theme
#> attr(,"add_risktable")$theme[[1]]
#> <theme> List of 144
#> $ line : <ggplot2::element_line>
#> ..@ colour : chr "black"
#> ..@ linewidth : num 0.5
#> ..@ linetype : num 1
#> ..@ lineend : chr "butt"
#> ..@ linejoin : chr "round"
#> ..@ arrow : logi FALSE
#> ..@ arrow.fill : chr "black"
#> ..@ inherit.blank: logi TRUE
#> $ rect : <ggplot2::element_rect>
#> ..@ fill : chr "white"
#> ..@ colour : chr "black"
#> ..@ linewidth : num 0.5
#> ..@ linetype : num 1
#> ..@ linejoin : chr "round"
#> ..@ inherit.blank: logi TRUE
#> $ text : <ggplot2::element_text>
#> ..@ family : chr ""
#> ..@ face : chr "plain"
#> ..@ italic : chr NA
#> ..@ fontweight : num NA
#> ..@ fontwidth : num NA
#> ..@ colour : chr "black"
#> ..@ size : num 11
#> ..@ hjust : num 0.5
#> ..@ vjust : num 0.5
#> ..@ angle : num 0
#> ..@ lineheight : num 0.9
#> ..@ margin : <ggplot2::margin> num [1:4] 0 0 0 0
#> ..@ debug : logi FALSE
#> ..@ inherit.blank: logi TRUE
#> $ title : <ggplot2::element_text>
#> ..@ family : NULL
#> ..@ face : NULL
#> ..@ italic : chr NA
#> ..@ fontweight : num NA
#> ..@ fontwidth : num NA
#> ..@ colour : NULL
#> ..@ size : NULL
#> ..@ hjust : NULL
#> ..@ vjust : NULL
#> ..@ angle : NULL
#> ..@ lineheight : NULL
#> ..@ margin : NULL
#> ..@ debug : NULL
#> ..@ inherit.blank: logi TRUE
#> $ point : <ggplot2::element_point>
#> ..@ colour : chr "black"
#> ..@ shape : num 19
#> ..@ size : num 1.5
#> ..@ fill : chr "white"
#> ..@ stroke : num 0.5
#> ..@ inherit.blank: logi TRUE
#> $ polygon : <ggplot2::element_polygon>
#> ..@ fill : chr "white"
#> ..@ colour : chr "black"
#> ..@ linewidth : num 0.5
#> ..@ linetype : num 1
#> ..@ linejoin : chr "round"
#> ..@ inherit.blank: logi TRUE
#> $ geom : <ggplot2::element_geom>
#> ..@ ink : chr "black"
#> ..@ paper : chr "white"
#> ..@ accent : chr "#3366FF"
#> ..@ linewidth : num 0.5
#> ..@ borderwidth: num 0.5
#> ..@ linetype : int 1
#> ..@ bordertype : int 1
#> ..@ family : chr ""
#> ..@ fontsize : num 3.87
#> ..@ pointsize : num 1.5
#> ..@ pointshape : num 19
#> ..@ colour : NULL
#> ..@ fill : NULL
#> $ spacing : 'simpleUnit' num 5.5points
#> ..- attr(*, "unit")= int 8
#> $ margins : <ggplot2::margin> num [1:4] 5.5 5.5 5.5 5.5
#> $ aspect.ratio : NULL
#> $ axis.title : NULL
#> $ axis.title.x : <ggplot2::element_text>
#> ..@ family : NULL
#> ..@ face : NULL
#> ..@ italic : chr NA
#> ..@ fontweight : num NA
#> ..@ fontwidth : num NA
#> ..@ colour : NULL
#> ..@ size : NULL
#> ..@ hjust : NULL
#> ..@ vjust : num 1
#> ..@ angle : NULL
#> ..@ lineheight : NULL
#> ..@ margin : <ggplot2::margin> num [1:4] 2.75 0 0 0
#> ..@ debug : NULL
#> ..@ inherit.blank: logi TRUE
#> $ axis.title.x.top : <ggplot2::element_text>
#> ..@ family : NULL
#> ..@ face : NULL
#> ..@ italic : chr NA
#> ..@ fontweight : num NA
#> ..@ fontwidth : num NA
#> ..@ colour : NULL
#> ..@ size : NULL
#> ..@ hjust : NULL
#> ..@ vjust : num 0
#> ..@ angle : NULL
#> ..@ lineheight : NULL
#> ..@ margin : <ggplot2::margin> num [1:4] 0 0 2.75 0
#> ..@ debug : NULL
#> ..@ inherit.blank: logi TRUE
#> $ axis.title.x.bottom : NULL
#> $ axis.title.y : <ggplot2::element_text>
#> ..@ family : NULL
#> ..@ face : NULL
#> ..@ italic : chr NA
#> ..@ fontweight : num NA
#> ..@ fontwidth : num NA
#> ..@ colour : NULL
#> ..@ size : NULL
#> ..@ hjust : NULL
#> ..@ vjust : num 1
#> ..@ angle : num 90
#> ..@ lineheight : NULL
#> ..@ margin : <ggplot2::margin> num [1:4] 0 2.75 0 0
#> ..@ debug : NULL
#> ..@ inherit.blank: logi TRUE
#> $ axis.title.y.left : NULL
#> $ axis.title.y.right : <ggplot2::element_text>
#> ..@ family : NULL
#> ..@ face : NULL
#> ..@ italic : chr NA
#> ..@ fontweight : num NA
#> ..@ fontwidth : num NA
#> ..@ colour : NULL
#> ..@ size : NULL
#> ..@ hjust : NULL
#> ..@ vjust : num 1
#> ..@ angle : num -90
#> ..@ lineheight : NULL
#> ..@ margin : <ggplot2::margin> num [1:4] 0 0 0 2.75
#> ..@ debug : NULL
#> ..@ inherit.blank: logi TRUE
#> $ axis.text : <ggplot2::element_text>
#> ..@ family : NULL
#> ..@ face : NULL
#> ..@ italic : chr NA
#> ..@ fontweight : num NA
#> ..@ fontwidth : num NA
#> ..@ colour : chr "#4D4D4DFF"
#> ..@ size : 'rel' num 0.8
#> ..@ hjust : NULL
#> ..@ vjust : NULL
#> ..@ angle : NULL
#> ..@ lineheight : NULL
#> ..@ margin : NULL
#> ..@ debug : NULL
#> ..@ inherit.blank: logi TRUE
#> $ axis.text.x : <ggplot2::element_text>
#> ..@ family : NULL
#> ..@ face : NULL
#> ..@ italic : chr NA
#> ..@ fontweight : num NA
#> ..@ fontwidth : num NA
#> ..@ colour : NULL
#> ..@ size : NULL
#> ..@ hjust : NULL
#> ..@ vjust : num 1
#> ..@ angle : NULL
#> ..@ lineheight : NULL
#> ..@ margin : <ggplot2::margin> num [1:4] 2.2 0 0 0
#> ..@ debug : NULL
#> ..@ inherit.blank: logi TRUE
#> $ axis.text.x.top : <ggplot2::element_text>
#> ..@ family : NULL
#> ..@ face : NULL
#> ..@ italic : chr NA
#> ..@ fontweight : num NA
#> ..@ fontwidth : num NA
#> ..@ colour : NULL
#> ..@ size : NULL
#> ..@ hjust : NULL
#> ..@ vjust : num 0
#> ..@ angle : NULL
#> ..@ lineheight : NULL
#> ..@ margin : <ggplot2::margin> num [1:4] 0 0 2.2 0
#> ..@ debug : NULL
#> ..@ inherit.blank: logi TRUE
#> $ axis.text.x.bottom : NULL
#> $ axis.text.y : <ggplot2::element_text>
#> ..@ family : NULL
#> ..@ face : NULL
#> ..@ italic : chr NA
#> ..@ fontweight : num NA
#> ..@ fontwidth : num NA
#> ..@ colour : NULL
#> ..@ size : NULL
#> ..@ hjust : num 1
#> ..@ vjust : NULL
#> ..@ angle : NULL
#> ..@ lineheight : NULL
#> ..@ margin : <ggplot2::margin> num [1:4] 0 2.2 0 0
#> ..@ debug : NULL
#> ..@ inherit.blank: logi TRUE
#> $ axis.text.y.left : NULL
#> $ axis.text.y.right : <ggplot2::element_text>
#> ..@ family : NULL
#> ..@ face : NULL
#> ..@ italic : chr NA
#> ..@ fontweight : num NA
#> ..@ fontwidth : num NA
#> ..@ colour : NULL
#> ..@ size : NULL
#> ..@ hjust : num 0
#> ..@ vjust : NULL
#> ..@ angle : NULL
#> ..@ lineheight : NULL
#> ..@ margin : <ggplot2::margin> num [1:4] 0 0 0 2.2
#> ..@ debug : NULL
#> ..@ inherit.blank: logi TRUE
#> $ axis.text.theta : NULL
#> $ axis.text.r : <ggplot2::element_text>
#> ..@ family : NULL
#> ..@ face : NULL
#> ..@ italic : chr NA
#> ..@ fontweight : num NA
#> ..@ fontwidth : num NA
#> ..@ colour : NULL
#> ..@ size : NULL
#> ..@ hjust : num 0.5
#> ..@ vjust : NULL
#> ..@ angle : NULL
#> ..@ lineheight : NULL
#> ..@ margin : <ggplot2::margin> num [1:4] 0 2.2 0 2.2
#> ..@ debug : NULL
#> ..@ inherit.blank: logi TRUE
#> $ axis.ticks : <ggplot2::element_line>
#> ..@ colour : chr "#333333FF"
#> ..@ linewidth : NULL
#> ..@ linetype : NULL
#> ..@ lineend : NULL
#> ..@ linejoin : NULL
#> ..@ arrow : logi FALSE
#> ..@ arrow.fill : chr "#333333FF"
#> ..@ inherit.blank: logi TRUE
#> $ axis.ticks.x : NULL
#> $ axis.ticks.x.top : NULL
#> $ axis.ticks.x.bottom : NULL
#> $ axis.ticks.y : NULL
#> $ axis.ticks.y.left : NULL
#> $ axis.ticks.y.right : NULL
#> $ axis.ticks.theta : NULL
#> $ axis.ticks.r : NULL
#> $ axis.minor.ticks.x.top : NULL
#> $ axis.minor.ticks.x.bottom : NULL
#> $ axis.minor.ticks.y.left : NULL
#> $ axis.minor.ticks.y.right : NULL
#> $ axis.minor.ticks.theta : NULL
#> $ axis.minor.ticks.r : NULL
#> $ axis.ticks.length : 'rel' num 0.5
#> $ axis.ticks.length.x : NULL
#> $ axis.ticks.length.x.top : NULL
#> $ axis.ticks.length.x.bottom : NULL
#> $ axis.ticks.length.y : NULL
#> $ axis.ticks.length.y.left : NULL
#> $ axis.ticks.length.y.right : NULL
#> $ axis.ticks.length.theta : NULL
#> $ axis.ticks.length.r : NULL
#> $ axis.minor.ticks.length : 'rel' num 0.75
#> $ axis.minor.ticks.length.x : NULL
#> $ axis.minor.ticks.length.x.top : NULL
#> $ axis.minor.ticks.length.x.bottom: NULL
#> $ axis.minor.ticks.length.y : NULL
#> $ axis.minor.ticks.length.y.left : NULL
#> $ axis.minor.ticks.length.y.right : NULL
#> $ axis.minor.ticks.length.theta : NULL
#> $ axis.minor.ticks.length.r : NULL
#> $ axis.line : <ggplot2::element_blank>
#> $ axis.line.x : NULL
#> $ axis.line.x.top : NULL
#> $ axis.line.x.bottom : NULL
#> $ axis.line.y : NULL
#> $ axis.line.y.left : NULL
#> $ axis.line.y.right : NULL
#> $ axis.line.theta : NULL
#> $ axis.line.r : NULL
#> $ legend.background : <ggplot2::element_rect>
#> ..@ fill : NULL
#> ..@ colour : logi NA
#> ..@ linewidth : NULL
#> ..@ linetype : NULL
#> ..@ linejoin : NULL
#> ..@ inherit.blank: logi TRUE
#> $ legend.margin : NULL
#> $ legend.spacing : 'rel' num 2
#> $ legend.spacing.x : NULL
#> $ legend.spacing.y : NULL
#> $ legend.key : NULL
#> $ legend.key.size : 'simpleUnit' num 1.2lines
#> ..- attr(*, "unit")= int 3
#> $ legend.key.height : NULL
#> $ legend.key.width : NULL
#> $ legend.key.spacing : NULL
#> $ legend.key.spacing.x : NULL
#> $ legend.key.spacing.y : NULL
#> $ legend.key.justification : NULL
#> $ legend.frame : NULL
#> $ legend.ticks : NULL
#> $ legend.ticks.length : 'rel' num 0.2
#> $ legend.axis.line : NULL
#> $ legend.text : <ggplot2::element_text>
#> ..@ family : NULL
#> ..@ face : NULL
#> ..@ italic : chr NA
#> ..@ fontweight : num NA
#> ..@ fontwidth : num NA
#> ..@ colour : NULL
#> ..@ size : 'rel' num 0.8
#> ..@ hjust : NULL
#> ..@ vjust : NULL
#> ..@ angle : NULL
#> ..@ lineheight : NULL
#> ..@ margin : NULL
#> ..@ debug : NULL
#> ..@ inherit.blank: logi TRUE
#> $ legend.text.position : NULL
#> $ legend.title : <ggplot2::element_text>
#> ..@ family : NULL
#> ..@ face : NULL
#> ..@ italic : chr NA
#> ..@ fontweight : num NA
#> ..@ fontwidth : num NA
#> ..@ colour : NULL
#> ..@ size : NULL
#> ..@ hjust : num 0
#> ..@ vjust : NULL
#> ..@ angle : NULL
#> ..@ lineheight : NULL
#> ..@ margin : NULL
#> ..@ debug : NULL
#> ..@ inherit.blank: logi TRUE
#> $ legend.title.position : NULL
#> $ legend.position : chr "right"
#> $ legend.position.inside : NULL
#> $ legend.direction : NULL
#> $ legend.byrow : NULL
#> $ legend.justification : chr "center"
#> $ legend.justification.top : NULL
#> $ legend.justification.bottom : NULL
#> $ legend.justification.left : NULL
#> $ legend.justification.right : NULL
#> $ legend.justification.inside : NULL
#> [list output truncated]
#> @ complete: logi TRUE
#> @ validate: logi TRUE
#>
#> attr(,"add_risktable")$theme[[2]]
#> <theme> List of 11
#> $ axis.title.x : <ggplot2::element_text>
#> ..@ family : NULL
#> ..@ face : NULL
#> ..@ italic : chr NA
#> ..@ fontweight : num NA
#> ..@ fontwidth : num NA
#> ..@ colour : NULL
#> ..@ size : num 9
#> ..@ hjust : num 1
#> ..@ vjust : num 1
#> ..@ angle : NULL
#> ..@ lineheight : NULL
#> ..@ margin : NULL
#> ..@ debug : NULL
#> ..@ inherit.blank: logi FALSE
#> $ axis.text.x : <ggplot2::element_blank>
#> $ axis.text.y : <ggplot2::element_text>
#> ..@ family : NULL
#> ..@ face : chr "plain"
#> ..@ italic : chr NA
#> ..@ fontweight : num NA
#> ..@ fontwidth : num NA
#> ..@ colour : chr "black"
#> ..@ size : num 10
#> ..@ hjust : NULL
#> ..@ vjust : NULL
#> ..@ angle : NULL
#> ..@ lineheight : NULL
#> ..@ margin : NULL
#> ..@ debug : NULL
#> ..@ inherit.blank: logi FALSE
#> $ axis.ticks : <ggplot2::element_blank>
#> $ axis.line : <ggplot2::element_blank>
#> $ legend.position : chr "none"
#> $ panel.border : <ggplot2::element_blank>
#> $ panel.grid.major: <ggplot2::element_blank>
#> $ panel.grid.minor: <ggplot2::element_blank>
#> $ plot.title : <ggplot2::element_text>
#> ..@ family : NULL
#> ..@ face : NULL
#> ..@ italic : chr NA
#> ..@ fontweight : num NA
#> ..@ fontwidth : num NA
#> ..@ colour : NULL
#> ..@ size : num 10.8
#> ..@ hjust : num 0
#> ..@ vjust : num 0
#> ..@ angle : NULL
#> ..@ lineheight : NULL
#> ..@ margin : NULL
#> ..@ debug : NULL
#> ..@ inherit.blank: logi FALSE
#> $ plot.margin : 'simpleUnit' num [1:4] 0points 5.5points 0points 5.5points
#> ..- attr(*, "unit")= int 8
#> @ complete: logi FALSE
#> @ validate: logi TRUE
#>
#> attr(,"add_risktable")$theme[[3]]
#> <ggplot2::labels> List of 1
#> $ x: NULL
#>
#> attr(,"add_risktable")$theme[[4]]
#> <ggplot2::labels> List of 1
#> $ y: NULL
#>
#>
#> attr(,"add_risktable")$size
#> [1] 3.5
#>
#> attr(,"class")
#> [1] "add_risktable"
if (requireNamespace("broom", quietly = TRUE)) {
broom::tidy(fit_breast, exponentiate = TRUE, conf.int = TRUE)
}
#> # A tibble: 1 × 7
#> term estimate std.error statistic p.value conf.low conf.high
#> <chr> <dbl> <dbl> <dbl> <dbl> <dbl> <dbl>
#> 1 stain 2.48 0.501 1.82 0.0695 0.930 6.63
if (requireNamespace("flexsurv", quietly = TRUE)) {
flexsurv::flexsurvreg(survival::Surv(time, status) ~ stain, data = breast, dist = "weibull")
}
#> Call:
#> flexsurv::flexsurvreg(formula = survival::Surv(time, status) ~
#> stain, data = breast, dist = "weibull")
#>
#> Estimates:
#> data mean est L95% U95% se exp(est)
#> shape NA 0.9374 0.6752 1.3014 0.1569 NA
#> scale NA 944.8522 128.6529 6939.1798 961.2170 NA
#> stain 1.7111 -0.9967 -2.0631 0.0697 0.5441 0.3691
#> L95% U95%
#> shape NA NA
#> scale NA NA
#> stain 0.1271 1.0722
#>
#> N = 45, Events: 26, Censored: 19
#> Total time at risk: 4331
#> Log-likelihood = -156.747, df = 3
#> AIC = 319.494
#>