Graft survival times of 1761 adult liver transplant recipients, with the cause of graft failure (Collett, 2023, Example 12.1).
Format
A data frame with 1761 rows and 7 variables:
- patient
Patient number (1-1761).
- age
Age of the patient in years.
- gender
Gender: 1 = male, 2 = female.
- disease
Primary liver disease: 1 = primary biliary cirrhosis (PBC), 2 = primary sclerosing cholangitis (PSC), 3 = alcoholic liver disease (ALD).
- time
Time from transplantation to graft failure, death or last follow-up, in days.
- status
Event indicator: 1 = graft failure or death, 0 = right-censored.
- cof
Cause of graft failure: 0 = functioning graft (censored), 1 = rejection, 2 = thrombosis, 3 = recurrent disease, 4 = other.
Source
Collett, D. (2023) Modelling Survival Data in Medical Research, 4th ed. Chapman & Hall/CRC, Example 12.1 (Table 12.1). Data from the UK Transplant Registry.
Details
The patients had a first elective transplant with an organ from a deceased
donor between January 2000 and December 2010 and were followed up to the end
of 2012. In the book there are 261 graft failures among the 1761 patients,
and an additional 211 patients die with a functioning graft; the failure
times of the latter group are censored at death. In the distributed file
status is 1 for 265 patients while cof is non-zero for 260, so the two
indicators are not perfectly consistent.
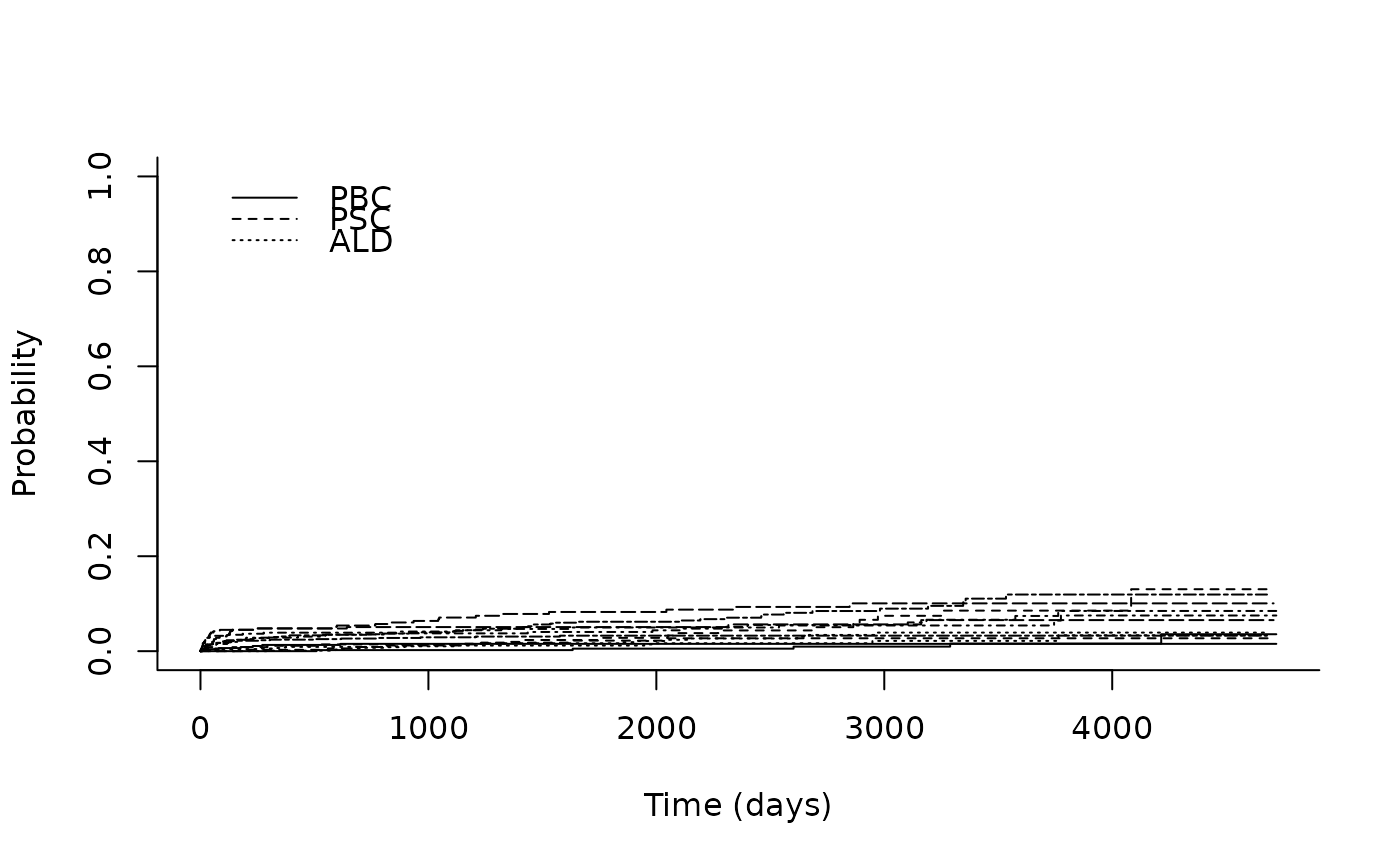
The data are the main illustration of competing risks: the cumulative incidence of each cause of graft failure, cause-specific hazard models and the subdistribution approach (Examples 12.1-12.6). See liver_wait for the waiting-list data from the same registry.
Aliases
The data set is available under the aliases d12.1, d12.2, d12.3,
d12.4, d12.5, d12.6; dX.Y is the alias for the data set used in
Example X.Y of Collett (2023). See dataset_by_exercise for the complete
index.
Examples
# Collett (2023), Chapter 17 style -----------------------------------
# Examples 12.1-12.6: cumulative incidence by cause of graft failure
# (cof: 1 = rejection, 2 = thrombosis, 3 = recurrent disease, 4 = other)
ci <- cmprsk::cuminc(liver$time, liver$cof, liver$disease)
plot(ci, curvlab = c("PBC", "PSC", "ALD"), xlab = "Time (days)")
 # A Fine-Gray model for one cause of failure (cause 2, thrombosis)
cmprsk::crr(
liver$time, liver$cof,
cov1 = as.matrix(liver[c("age", "gender")]),
failcode = 2
)
#> convergence: TRUE
#> coefficients:
#> age gender
#> -0.0253 0.1652
#> standard errors:
#> [1] 0.01024 0.23530
#> two-sided p-values:
#> age gender
#> 0.013 0.480
# Modern tools --------------------------------------------------------
if (requireNamespace("tidycmprsk", quietly = TRUE)) {
tidycmprsk::cuminc(survival::Surv(time, factor(cof)) ~ disease, data = liver)
tidycmprsk::crr(
survival::Surv(time, factor(cof)) ~ age + gender,
data = liver, failcode = "2"
)
}
#>
#> ── crr() ───────────────────────────────────────────────────────────────────────
#> • Call survival::Surv(time, factor(cof)) ~ age + gender
#> • Failure type of interest "2"
#>
#> Variable Coef SE HR 95% CI p-value
#> age -0.025 0.010 0.98 0.96, 1.0 0.013
#> gender 0.165 0.235 1.18 0.74, 1.87 0.48