A cohort of 850 patients diagnosed with metastatic breast cancer, used in the computer exercise on survival analysis. The data are not from Collett (2023); they come from the teaching material of the Edinburgh Cancer Informatics group, which is redistributed here (see Source).
Format
A data frame with 850 rows and 21 variables:
- patient_id
Patient identifier,
MBC0001toMBC0850.- health_board
NHS Health Board of the treating centre, one of the 14 Scottish boards.
- age_at_diagnosis
Age at diagnosis of metastatic disease, in years.
- sex
Sex of the patient.
- simd_quintile
Scottish Index of Multiple Deprivation quintile, 1 (most deprived) to 5 (least deprived).
- ecog_ps
ECOG performance status at baseline: 0 (best) to 3 (worst).
- er_status
Oestrogen receptor status:
PositiveorNegative.- pr_status
Progesterone receptor status:
PositiveorNegative.- her2_status
HER2 status:
PositiveorNegative.- n_metastatic_sites
Number of metastatic sites at diagnosis.
- bone_mets, liver_mets, lung_mets, brain_mets
Metastatic involvement of bone, liver, lung and brain:
YesorNo.- presentation
De novo metastaticorRecurrentdisease.- diagnosis_date
Date of diagnosis of metastatic disease.
- first_line_treatment
First-line treatment.
- observed_time
Follow-up time in months from diagnosis to death or censoring.
- status
Event indicator: 1 = death, 0 = right-censored.
- age_group
Age group at diagnosis:
<50,50-64,65-74or75+.- hormone_receptor
Hormone receptor status:
HR-positiveorHR-negative, derived fromer_statusandpr_status.
Source
The file scottish_mbc_cohort.xlsx in the onco-stats repository of
the Edinburgh Cancer Informatics group,
https://github.com/Edinburgh-Cancer-Informatics/onco-stats/tree/main/docs/data,
redistributed under the MIT licence of that repository (Copyright (c) 2025
Edinburgh-Cancer-Informatics). See also Survival Analysis in R: A
Practical Tutorial,
https://edinburgh-cancer-informatics.github.io/onco-stats/tutorials/survival_analysis_tutorial.html,
which documents the same cohort and the simulation that generated it.
Details
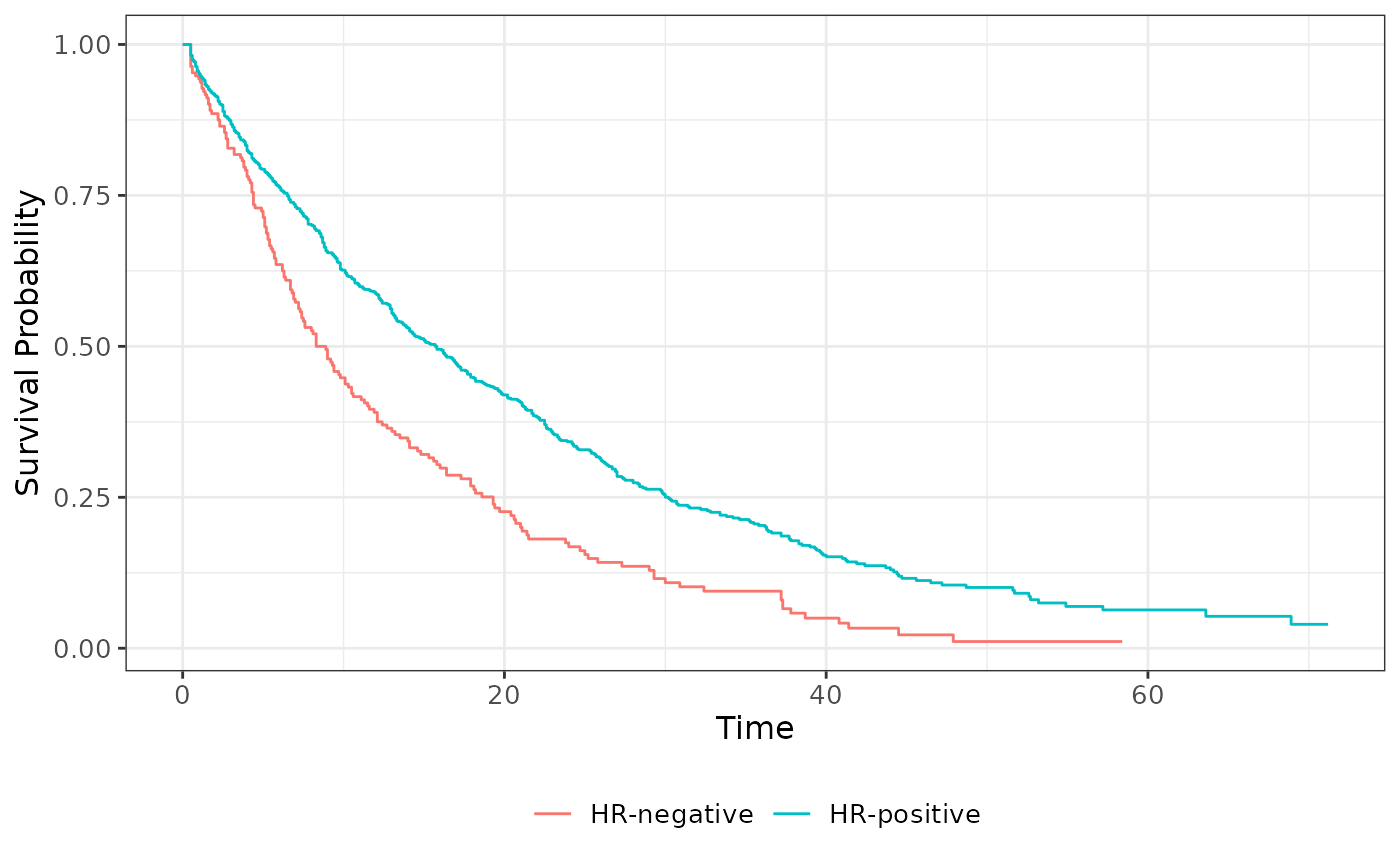
The time origin is the date of diagnosis of metastatic breast cancer and the time scale is time since diagnosis, in months. The event of interest is death from any cause; patients who were alive at the end of follow-up are right-censored. Of the 850 patients, 703 died and 147 (17.3 %) were censored, and the observed follow-up times range from 0.5 to 71.2 months. The patients were diagnosed between 5 January 2018 and 28 December 2022.
The cohort is entirely synthetic. It was generated for teaching purposes and contains no real patient data, but it was designed to reproduce realistic patterns of metastatic breast cancer in Scotland. The code that generated it, together with a longer walk-through of the same cohort, is part of the tutorial by the Edinburgh Cancer Informatics group that is cited under Source.
Compared with the data sets from Collett (2023), two columns are stored in a
slightly different form: status is an integer and diagnosis_date a Date,
so that the object matches the other data sets in the package. Otherwise the
file is used as distributed.
Aliases
This course data set is not used in a numbered example, so it has no dX.Y
alias. See dataset_by_exercise for the complete index.
Examples
# Not from Collett (2023) ---------------------------------------------
# The synthetic Scottish metastatic breast cancer cohort used in the
# first computer exercise; see the vignette cs1-survival-data.
survival::survfit(
survival::Surv(observed_time, status) ~ hormone_receptor,
data = scottish_mbc_cohort
)
#> Call: survfit(formula = survival::Surv(observed_time, status) ~ hormone_receptor,
#> data = scottish_mbc_cohort)
#>
#> n events median 0.95LCL 0.95UCL
#> hormone_receptor=HR-negative 192 176 8.6 7.2 10.5
#> hormone_receptor=HR-positive 658 527 15.7 13.7 17.6
# Modern tools --------------------------------------------------------
if (requireNamespace("ggsurvfit", quietly = TRUE)) {
ggsurvfit::survfit2(
survival::Surv(observed_time, status) ~ hormone_receptor,
data = scottish_mbc_cohort
) |>
ggsurvfit::ggsurvfit() |>
ggsurvfit::add_risktable()
}
#> list()
#> attr(,"add_risktable")
#> attr(,"add_risktable")$times
 #>
#> attr(,"add_risktable")$risktable_stats
#> [1] "{n.risk}" "{cum.event}"
#>
#> attr(,"add_risktable")$stats_label
#> NULL
#>
#> attr(,"add_risktable")$combine_groups
#> [1] FALSE
#>
#> attr(,"add_risktable")$risktable_group
#> [1] "auto"
#>
#> attr(,"add_risktable")$risktable_height
#> NULL
#>
#> attr(,"add_risktable")$theme
#> attr(,"add_risktable")$theme[[1]]
#> <theme> List of 144
#> $ line : <ggplot2::element_line>
#> ..@ colour : chr "black"
#> ..@ linewidth : num 0.5
#> ..@ linetype : num 1
#> ..@ lineend : chr "butt"
#> ..@ linejoin : chr "round"
#> ..@ arrow : logi FALSE
#> ..@ arrow.fill : chr "black"
#> ..@ inherit.blank: logi TRUE
#> $ rect : <ggplot2::element_rect>
#> ..@ fill : chr "white"
#> ..@ colour : chr "black"
#> ..@ linewidth : num 0.5
#> ..@ linetype : num 1
#> ..@ linejoin : chr "round"
#> ..@ inherit.blank: logi TRUE
#> $ text : <ggplot2::element_text>
#> ..@ family : chr ""
#> ..@ face : chr "plain"
#> ..@ italic : chr NA
#> ..@ fontweight : num NA
#> ..@ fontwidth : num NA
#> ..@ colour : chr "black"
#> ..@ size : num 11
#> ..@ hjust : num 0.5
#> ..@ vjust : num 0.5
#> ..@ angle : num 0
#> ..@ lineheight : num 0.9
#> ..@ margin : <ggplot2::margin> num [1:4] 0 0 0 0
#> ..@ debug : logi FALSE
#> ..@ inherit.blank: logi TRUE
#> $ title : <ggplot2::element_text>
#> ..@ family : NULL
#> ..@ face : NULL
#> ..@ italic : chr NA
#> ..@ fontweight : num NA
#> ..@ fontwidth : num NA
#> ..@ colour : NULL
#> ..@ size : NULL
#> ..@ hjust : NULL
#> ..@ vjust : NULL
#> ..@ angle : NULL
#> ..@ lineheight : NULL
#> ..@ margin : NULL
#> ..@ debug : NULL
#> ..@ inherit.blank: logi TRUE
#> $ point : <ggplot2::element_point>
#> ..@ colour : chr "black"
#> ..@ shape : num 19
#> ..@ size : num 1.5
#> ..@ fill : chr "white"
#> ..@ stroke : num 0.5
#> ..@ inherit.blank: logi TRUE
#> $ polygon : <ggplot2::element_polygon>
#> ..@ fill : chr "white"
#> ..@ colour : chr "black"
#> ..@ linewidth : num 0.5
#> ..@ linetype : num 1
#> ..@ linejoin : chr "round"
#> ..@ inherit.blank: logi TRUE
#> $ geom : <ggplot2::element_geom>
#> ..@ ink : chr "black"
#> ..@ paper : chr "white"
#> ..@ accent : chr "#3366FF"
#> ..@ linewidth : num 0.5
#> ..@ borderwidth: num 0.5
#> ..@ linetype : int 1
#> ..@ bordertype : int 1
#> ..@ family : chr ""
#> ..@ fontsize : num 3.87
#> ..@ pointsize : num 1.5
#> ..@ pointshape : num 19
#> ..@ colour : NULL
#> ..@ fill : NULL
#> $ spacing : 'simpleUnit' num 5.5points
#> ..- attr(*, "unit")= int 8
#> $ margins : <ggplot2::margin> num [1:4] 5.5 5.5 5.5 5.5
#> $ aspect.ratio : NULL
#> $ axis.title : NULL
#> $ axis.title.x : <ggplot2::element_text>
#> ..@ family : NULL
#> ..@ face : NULL
#> ..@ italic : chr NA
#> ..@ fontweight : num NA
#> ..@ fontwidth : num NA
#> ..@ colour : NULL
#> ..@ size : NULL
#> ..@ hjust : NULL
#> ..@ vjust : num 1
#> ..@ angle : NULL
#> ..@ lineheight : NULL
#> ..@ margin : <ggplot2::margin> num [1:4] 2.75 0 0 0
#> ..@ debug : NULL
#> ..@ inherit.blank: logi TRUE
#> $ axis.title.x.top : <ggplot2::element_text>
#> ..@ family : NULL
#> ..@ face : NULL
#> ..@ italic : chr NA
#> ..@ fontweight : num NA
#> ..@ fontwidth : num NA
#> ..@ colour : NULL
#> ..@ size : NULL
#> ..@ hjust : NULL
#> ..@ vjust : num 0
#> ..@ angle : NULL
#> ..@ lineheight : NULL
#> ..@ margin : <ggplot2::margin> num [1:4] 0 0 2.75 0
#> ..@ debug : NULL
#> ..@ inherit.blank: logi TRUE
#> $ axis.title.x.bottom : NULL
#> $ axis.title.y : <ggplot2::element_text>
#> ..@ family : NULL
#> ..@ face : NULL
#> ..@ italic : chr NA
#> ..@ fontweight : num NA
#> ..@ fontwidth : num NA
#> ..@ colour : NULL
#> ..@ size : NULL
#> ..@ hjust : NULL
#> ..@ vjust : num 1
#> ..@ angle : num 90
#> ..@ lineheight : NULL
#> ..@ margin : <ggplot2::margin> num [1:4] 0 2.75 0 0
#> ..@ debug : NULL
#> ..@ inherit.blank: logi TRUE
#> $ axis.title.y.left : NULL
#> $ axis.title.y.right : <ggplot2::element_text>
#> ..@ family : NULL
#> ..@ face : NULL
#> ..@ italic : chr NA
#> ..@ fontweight : num NA
#> ..@ fontwidth : num NA
#> ..@ colour : NULL
#> ..@ size : NULL
#> ..@ hjust : NULL
#> ..@ vjust : num 1
#> ..@ angle : num -90
#> ..@ lineheight : NULL
#> ..@ margin : <ggplot2::margin> num [1:4] 0 0 0 2.75
#> ..@ debug : NULL
#> ..@ inherit.blank: logi TRUE
#> $ axis.text : <ggplot2::element_text>
#> ..@ family : NULL
#> ..@ face : NULL
#> ..@ italic : chr NA
#> ..@ fontweight : num NA
#> ..@ fontwidth : num NA
#> ..@ colour : chr "#4D4D4DFF"
#> ..@ size : 'rel' num 0.8
#> ..@ hjust : NULL
#> ..@ vjust : NULL
#> ..@ angle : NULL
#> ..@ lineheight : NULL
#> ..@ margin : NULL
#> ..@ debug : NULL
#> ..@ inherit.blank: logi TRUE
#> $ axis.text.x : <ggplot2::element_text>
#> ..@ family : NULL
#> ..@ face : NULL
#> ..@ italic : chr NA
#> ..@ fontweight : num NA
#> ..@ fontwidth : num NA
#> ..@ colour : NULL
#> ..@ size : NULL
#> ..@ hjust : NULL
#> ..@ vjust : num 1
#> ..@ angle : NULL
#> ..@ lineheight : NULL
#> ..@ margin : <ggplot2::margin> num [1:4] 2.2 0 0 0
#> ..@ debug : NULL
#> ..@ inherit.blank: logi TRUE
#> $ axis.text.x.top : <ggplot2::element_text>
#> ..@ family : NULL
#> ..@ face : NULL
#> ..@ italic : chr NA
#> ..@ fontweight : num NA
#> ..@ fontwidth : num NA
#> ..@ colour : NULL
#> ..@ size : NULL
#> ..@ hjust : NULL
#> ..@ vjust : num 0
#> ..@ angle : NULL
#> ..@ lineheight : NULL
#> ..@ margin : <ggplot2::margin> num [1:4] 0 0 2.2 0
#> ..@ debug : NULL
#> ..@ inherit.blank: logi TRUE
#> $ axis.text.x.bottom : NULL
#> $ axis.text.y : <ggplot2::element_text>
#> ..@ family : NULL
#> ..@ face : NULL
#> ..@ italic : chr NA
#> ..@ fontweight : num NA
#> ..@ fontwidth : num NA
#> ..@ colour : NULL
#> ..@ size : NULL
#> ..@ hjust : num 1
#> ..@ vjust : NULL
#> ..@ angle : NULL
#> ..@ lineheight : NULL
#> ..@ margin : <ggplot2::margin> num [1:4] 0 2.2 0 0
#> ..@ debug : NULL
#> ..@ inherit.blank: logi TRUE
#> $ axis.text.y.left : NULL
#> $ axis.text.y.right : <ggplot2::element_text>
#> ..@ family : NULL
#> ..@ face : NULL
#> ..@ italic : chr NA
#> ..@ fontweight : num NA
#> ..@ fontwidth : num NA
#> ..@ colour : NULL
#> ..@ size : NULL
#> ..@ hjust : num 0
#> ..@ vjust : NULL
#> ..@ angle : NULL
#> ..@ lineheight : NULL
#> ..@ margin : <ggplot2::margin> num [1:4] 0 0 0 2.2
#> ..@ debug : NULL
#> ..@ inherit.blank: logi TRUE
#> $ axis.text.theta : NULL
#> $ axis.text.r : <ggplot2::element_text>
#> ..@ family : NULL
#> ..@ face : NULL
#> ..@ italic : chr NA
#> ..@ fontweight : num NA
#> ..@ fontwidth : num NA
#> ..@ colour : NULL
#> ..@ size : NULL
#> ..@ hjust : num 0.5
#> ..@ vjust : NULL
#> ..@ angle : NULL
#> ..@ lineheight : NULL
#> ..@ margin : <ggplot2::margin> num [1:4] 0 2.2 0 2.2
#> ..@ debug : NULL
#> ..@ inherit.blank: logi TRUE
#> $ axis.ticks : <ggplot2::element_line>
#> ..@ colour : chr "#333333FF"
#> ..@ linewidth : NULL
#> ..@ linetype : NULL
#> ..@ lineend : NULL
#> ..@ linejoin : NULL
#> ..@ arrow : logi FALSE
#> ..@ arrow.fill : chr "#333333FF"
#> ..@ inherit.blank: logi TRUE
#> $ axis.ticks.x : NULL
#> $ axis.ticks.x.top : NULL
#> $ axis.ticks.x.bottom : NULL
#> $ axis.ticks.y : NULL
#> $ axis.ticks.y.left : NULL
#> $ axis.ticks.y.right : NULL
#> $ axis.ticks.theta : NULL
#> $ axis.ticks.r : NULL
#> $ axis.minor.ticks.x.top : NULL
#> $ axis.minor.ticks.x.bottom : NULL
#> $ axis.minor.ticks.y.left : NULL
#> $ axis.minor.ticks.y.right : NULL
#> $ axis.minor.ticks.theta : NULL
#> $ axis.minor.ticks.r : NULL
#> $ axis.ticks.length : 'rel' num 0.5
#> $ axis.ticks.length.x : NULL
#> $ axis.ticks.length.x.top : NULL
#> $ axis.ticks.length.x.bottom : NULL
#> $ axis.ticks.length.y : NULL
#> $ axis.ticks.length.y.left : NULL
#> $ axis.ticks.length.y.right : NULL
#> $ axis.ticks.length.theta : NULL
#> $ axis.ticks.length.r : NULL
#> $ axis.minor.ticks.length : 'rel' num 0.75
#> $ axis.minor.ticks.length.x : NULL
#> $ axis.minor.ticks.length.x.top : NULL
#> $ axis.minor.ticks.length.x.bottom: NULL
#> $ axis.minor.ticks.length.y : NULL
#> $ axis.minor.ticks.length.y.left : NULL
#> $ axis.minor.ticks.length.y.right : NULL
#> $ axis.minor.ticks.length.theta : NULL
#> $ axis.minor.ticks.length.r : NULL
#> $ axis.line : <ggplot2::element_blank>
#> $ axis.line.x : NULL
#> $ axis.line.x.top : NULL
#> $ axis.line.x.bottom : NULL
#> $ axis.line.y : NULL
#> $ axis.line.y.left : NULL
#> $ axis.line.y.right : NULL
#> $ axis.line.theta : NULL
#> $ axis.line.r : NULL
#> $ legend.background : <ggplot2::element_rect>
#> ..@ fill : NULL
#> ..@ colour : logi NA
#> ..@ linewidth : NULL
#> ..@ linetype : NULL
#> ..@ linejoin : NULL
#> ..@ inherit.blank: logi TRUE
#> $ legend.margin : NULL
#> $ legend.spacing : 'rel' num 2
#> $ legend.spacing.x : NULL
#> $ legend.spacing.y : NULL
#> $ legend.key : NULL
#> $ legend.key.size : 'simpleUnit' num 1.2lines
#> ..- attr(*, "unit")= int 3
#> $ legend.key.height : NULL
#> $ legend.key.width : NULL
#> $ legend.key.spacing : NULL
#> $ legend.key.spacing.x : NULL
#> $ legend.key.spacing.y : NULL
#> $ legend.key.justification : NULL
#> $ legend.frame : NULL
#> $ legend.ticks : NULL
#> $ legend.ticks.length : 'rel' num 0.2
#> $ legend.axis.line : NULL
#> $ legend.text : <ggplot2::element_text>
#> ..@ family : NULL
#> ..@ face : NULL
#> ..@ italic : chr NA
#> ..@ fontweight : num NA
#> ..@ fontwidth : num NA
#> ..@ colour : NULL
#> ..@ size : 'rel' num 0.8
#> ..@ hjust : NULL
#> ..@ vjust : NULL
#> ..@ angle : NULL
#> ..@ lineheight : NULL
#> ..@ margin : NULL
#> ..@ debug : NULL
#> ..@ inherit.blank: logi TRUE
#> $ legend.text.position : NULL
#> $ legend.title : <ggplot2::element_text>
#> ..@ family : NULL
#> ..@ face : NULL
#> ..@ italic : chr NA
#> ..@ fontweight : num NA
#> ..@ fontwidth : num NA
#> ..@ colour : NULL
#> ..@ size : NULL
#> ..@ hjust : num 0
#> ..@ vjust : NULL
#> ..@ angle : NULL
#> ..@ lineheight : NULL
#> ..@ margin : NULL
#> ..@ debug : NULL
#> ..@ inherit.blank: logi TRUE
#> $ legend.title.position : NULL
#> $ legend.position : chr "right"
#> $ legend.position.inside : NULL
#> $ legend.direction : NULL
#> $ legend.byrow : NULL
#> $ legend.justification : chr "center"
#> $ legend.justification.top : NULL
#> $ legend.justification.bottom : NULL
#> $ legend.justification.left : NULL
#> $ legend.justification.right : NULL
#> $ legend.justification.inside : NULL
#> [list output truncated]
#> @ complete: logi TRUE
#> @ validate: logi TRUE
#>
#> attr(,"add_risktable")$theme[[2]]
#> <theme> List of 11
#> $ axis.title.x : <ggplot2::element_text>
#> ..@ family : NULL
#> ..@ face : NULL
#> ..@ italic : chr NA
#> ..@ fontweight : num NA
#> ..@ fontwidth : num NA
#> ..@ colour : NULL
#> ..@ size : num 9
#> ..@ hjust : num 1
#> ..@ vjust : num 1
#> ..@ angle : NULL
#> ..@ lineheight : NULL
#> ..@ margin : NULL
#> ..@ debug : NULL
#> ..@ inherit.blank: logi FALSE
#> $ axis.text.x : <ggplot2::element_blank>
#> $ axis.text.y : <ggplot2::element_text>
#> ..@ family : NULL
#> ..@ face : chr "plain"
#> ..@ italic : chr NA
#> ..@ fontweight : num NA
#> ..@ fontwidth : num NA
#> ..@ colour : chr "black"
#> ..@ size : num 10
#> ..@ hjust : NULL
#> ..@ vjust : NULL
#> ..@ angle : NULL
#> ..@ lineheight : NULL
#> ..@ margin : NULL
#> ..@ debug : NULL
#> ..@ inherit.blank: logi FALSE
#> $ axis.ticks : <ggplot2::element_blank>
#> $ axis.line : <ggplot2::element_blank>
#> $ legend.position : chr "none"
#> $ panel.border : <ggplot2::element_blank>
#> $ panel.grid.major: <ggplot2::element_blank>
#> $ panel.grid.minor: <ggplot2::element_blank>
#> $ plot.title : <ggplot2::element_text>
#> ..@ family : NULL
#> ..@ face : NULL
#> ..@ italic : chr NA
#> ..@ fontweight : num NA
#> ..@ fontwidth : num NA
#> ..@ colour : NULL
#> ..@ size : num 10.8
#> ..@ hjust : num 0
#> ..@ vjust : num 0
#> ..@ angle : NULL
#> ..@ lineheight : NULL
#> ..@ margin : NULL
#> ..@ debug : NULL
#> ..@ inherit.blank: logi FALSE
#> $ plot.margin : 'simpleUnit' num [1:4] 0points 5.5points 0points 5.5points
#> ..- attr(*, "unit")= int 8
#> @ complete: logi FALSE
#> @ validate: logi TRUE
#>
#> attr(,"add_risktable")$theme[[3]]
#> <ggplot2::labels> List of 1
#> $ x: NULL
#>
#> attr(,"add_risktable")$theme[[4]]
#> <ggplot2::labels> List of 1
#> $ y: NULL
#>
#>
#> attr(,"add_risktable")$size
#> [1] 3.5
#>
#> attr(,"class")
#> [1] "add_risktable"
if (requireNamespace("broom", quietly = TRUE)) {
broom::tidy(
survival::coxph(
survival::Surv(observed_time, status) ~ age_at_diagnosis +
factor(hormone_receptor) + factor(ecog_ps),
data = scottish_mbc_cohort
),
exponentiate = TRUE, conf.int = TRUE
)
}
#> # A tibble: 5 × 7
#> term estimate std.error statistic p.value conf.low conf.high
#> <chr> <dbl> <dbl> <dbl> <dbl> <dbl> <dbl>
#> 1 age_at_diagnosis 1.02 0.00318 4.72 2.41e- 6 1.01 1.02
#> 2 factor(hormone_recep… 0.567 0.0887 -6.41 1.50e-10 0.476 0.674
#> 3 factor(ecog_ps)1 1.27 0.0950 2.48 1.32e- 2 1.05 1.52
#> 4 factor(ecog_ps)2 2.31 0.107 7.83 4.79e-15 1.88 2.85
#> 5 factor(ecog_ps)3 2.91 0.151 7.06 1.65e-12 2.16 3.92